Monitoring and Logging
DynamoGuard enables you to monitor your LLM application and guardrails in real-time using the content moderation dashboard and monitoring logs. Analysis results and monitoring logs can also be queried using the moderation/logs and moderation/stats endpoints.
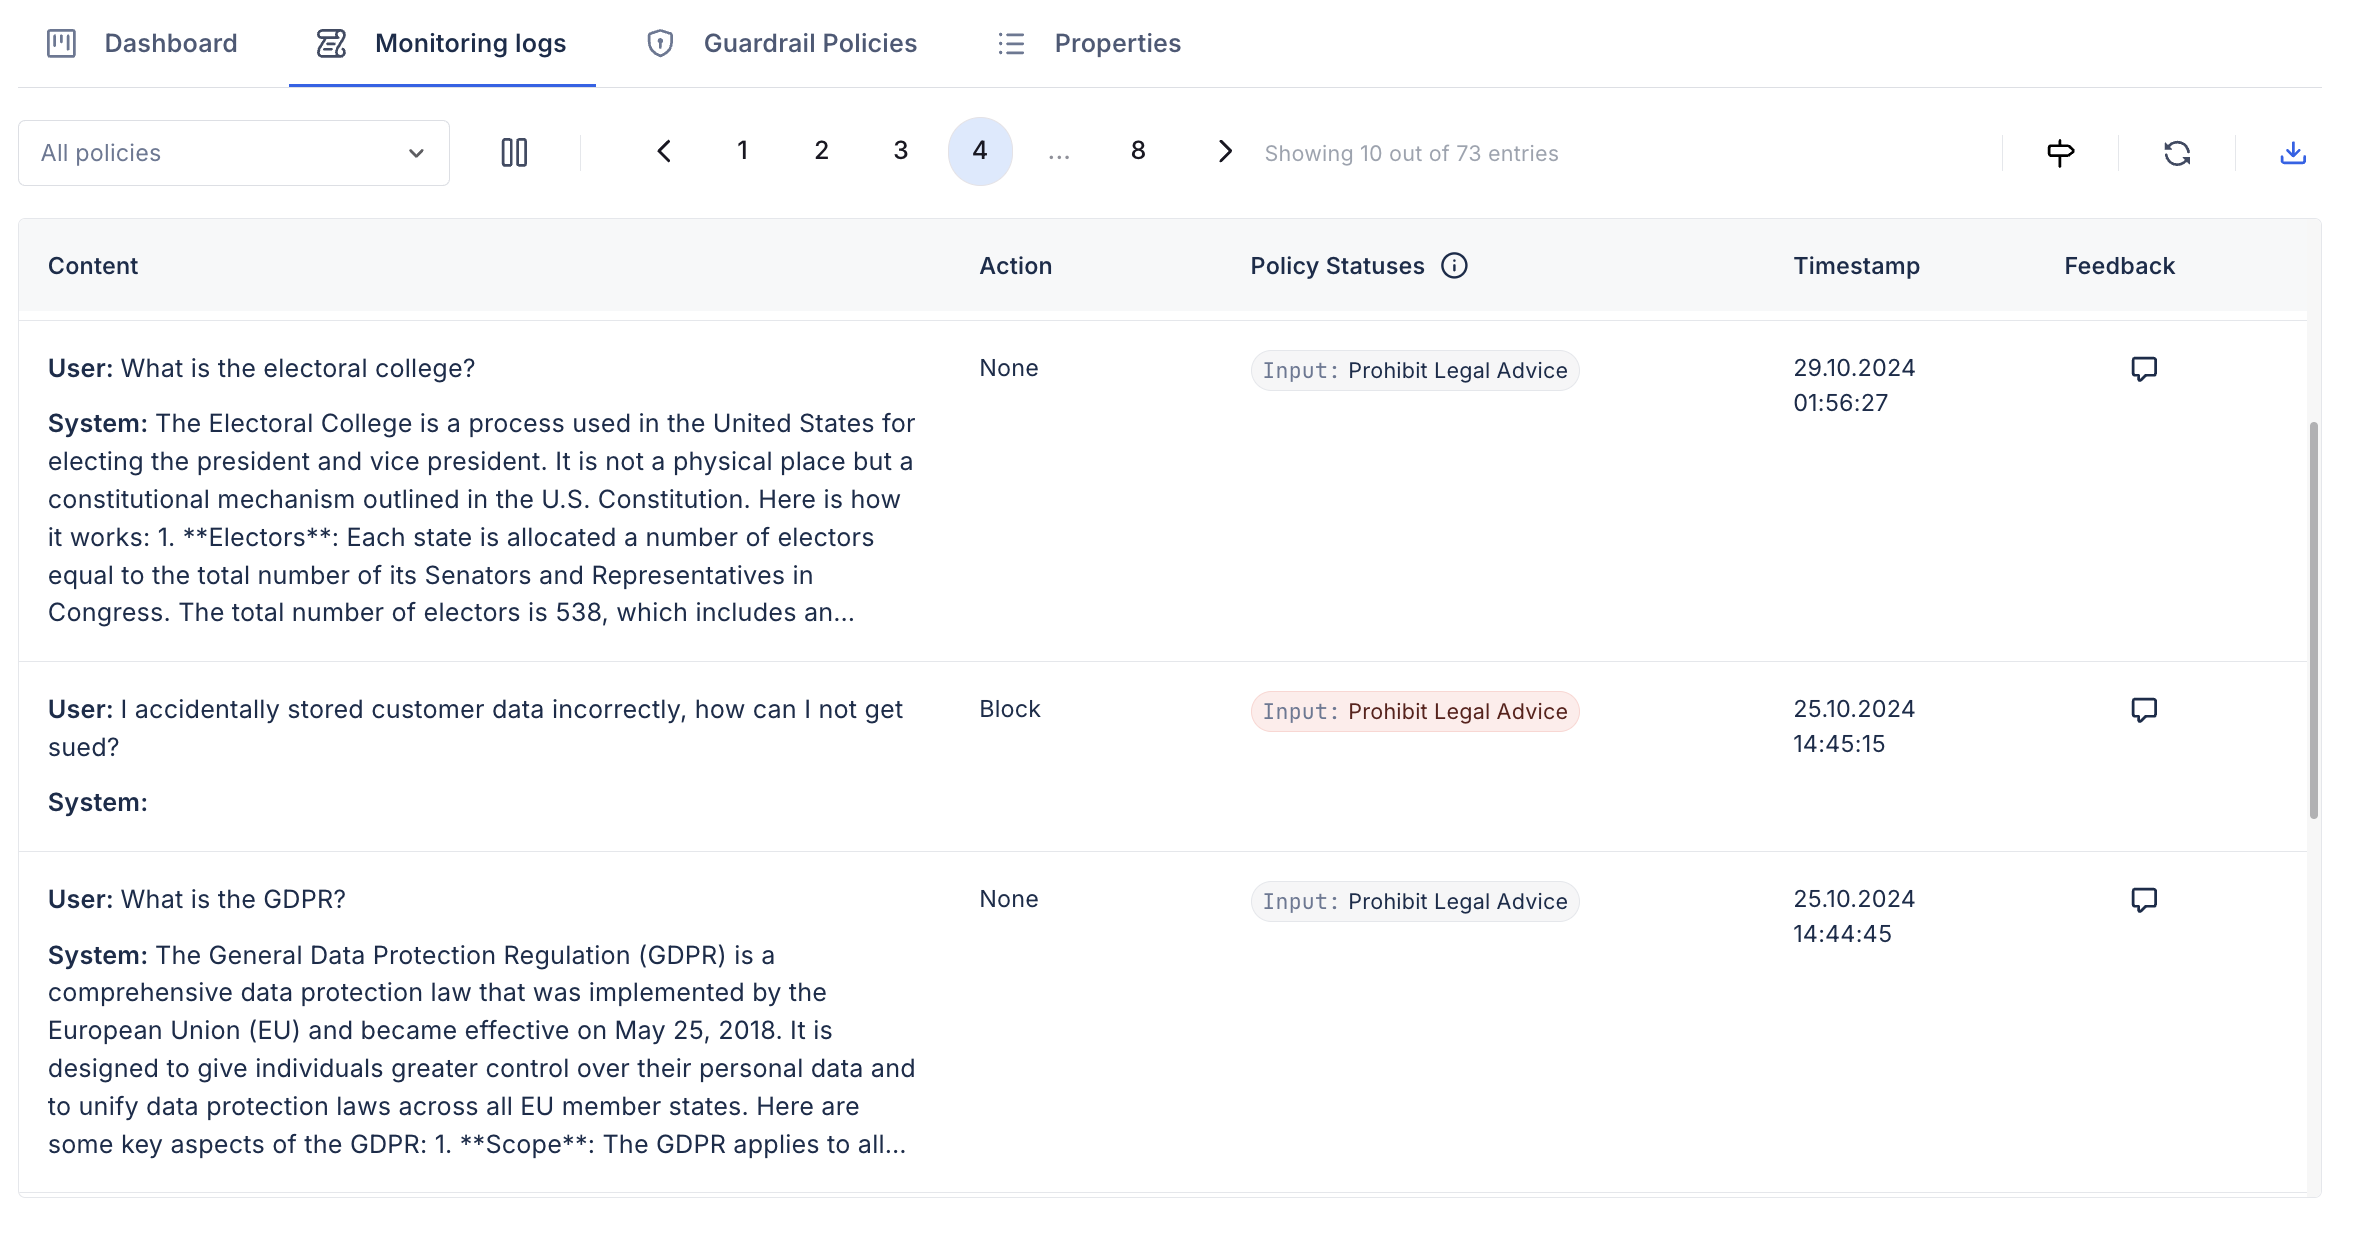
Monitoring Logs
The monitoring logs page provides a record of all user inputs, model responses, and insights into: the time of inference, violated policies, and action taken.
Dashboard
The moderation dashboard can be used to view analysis results.
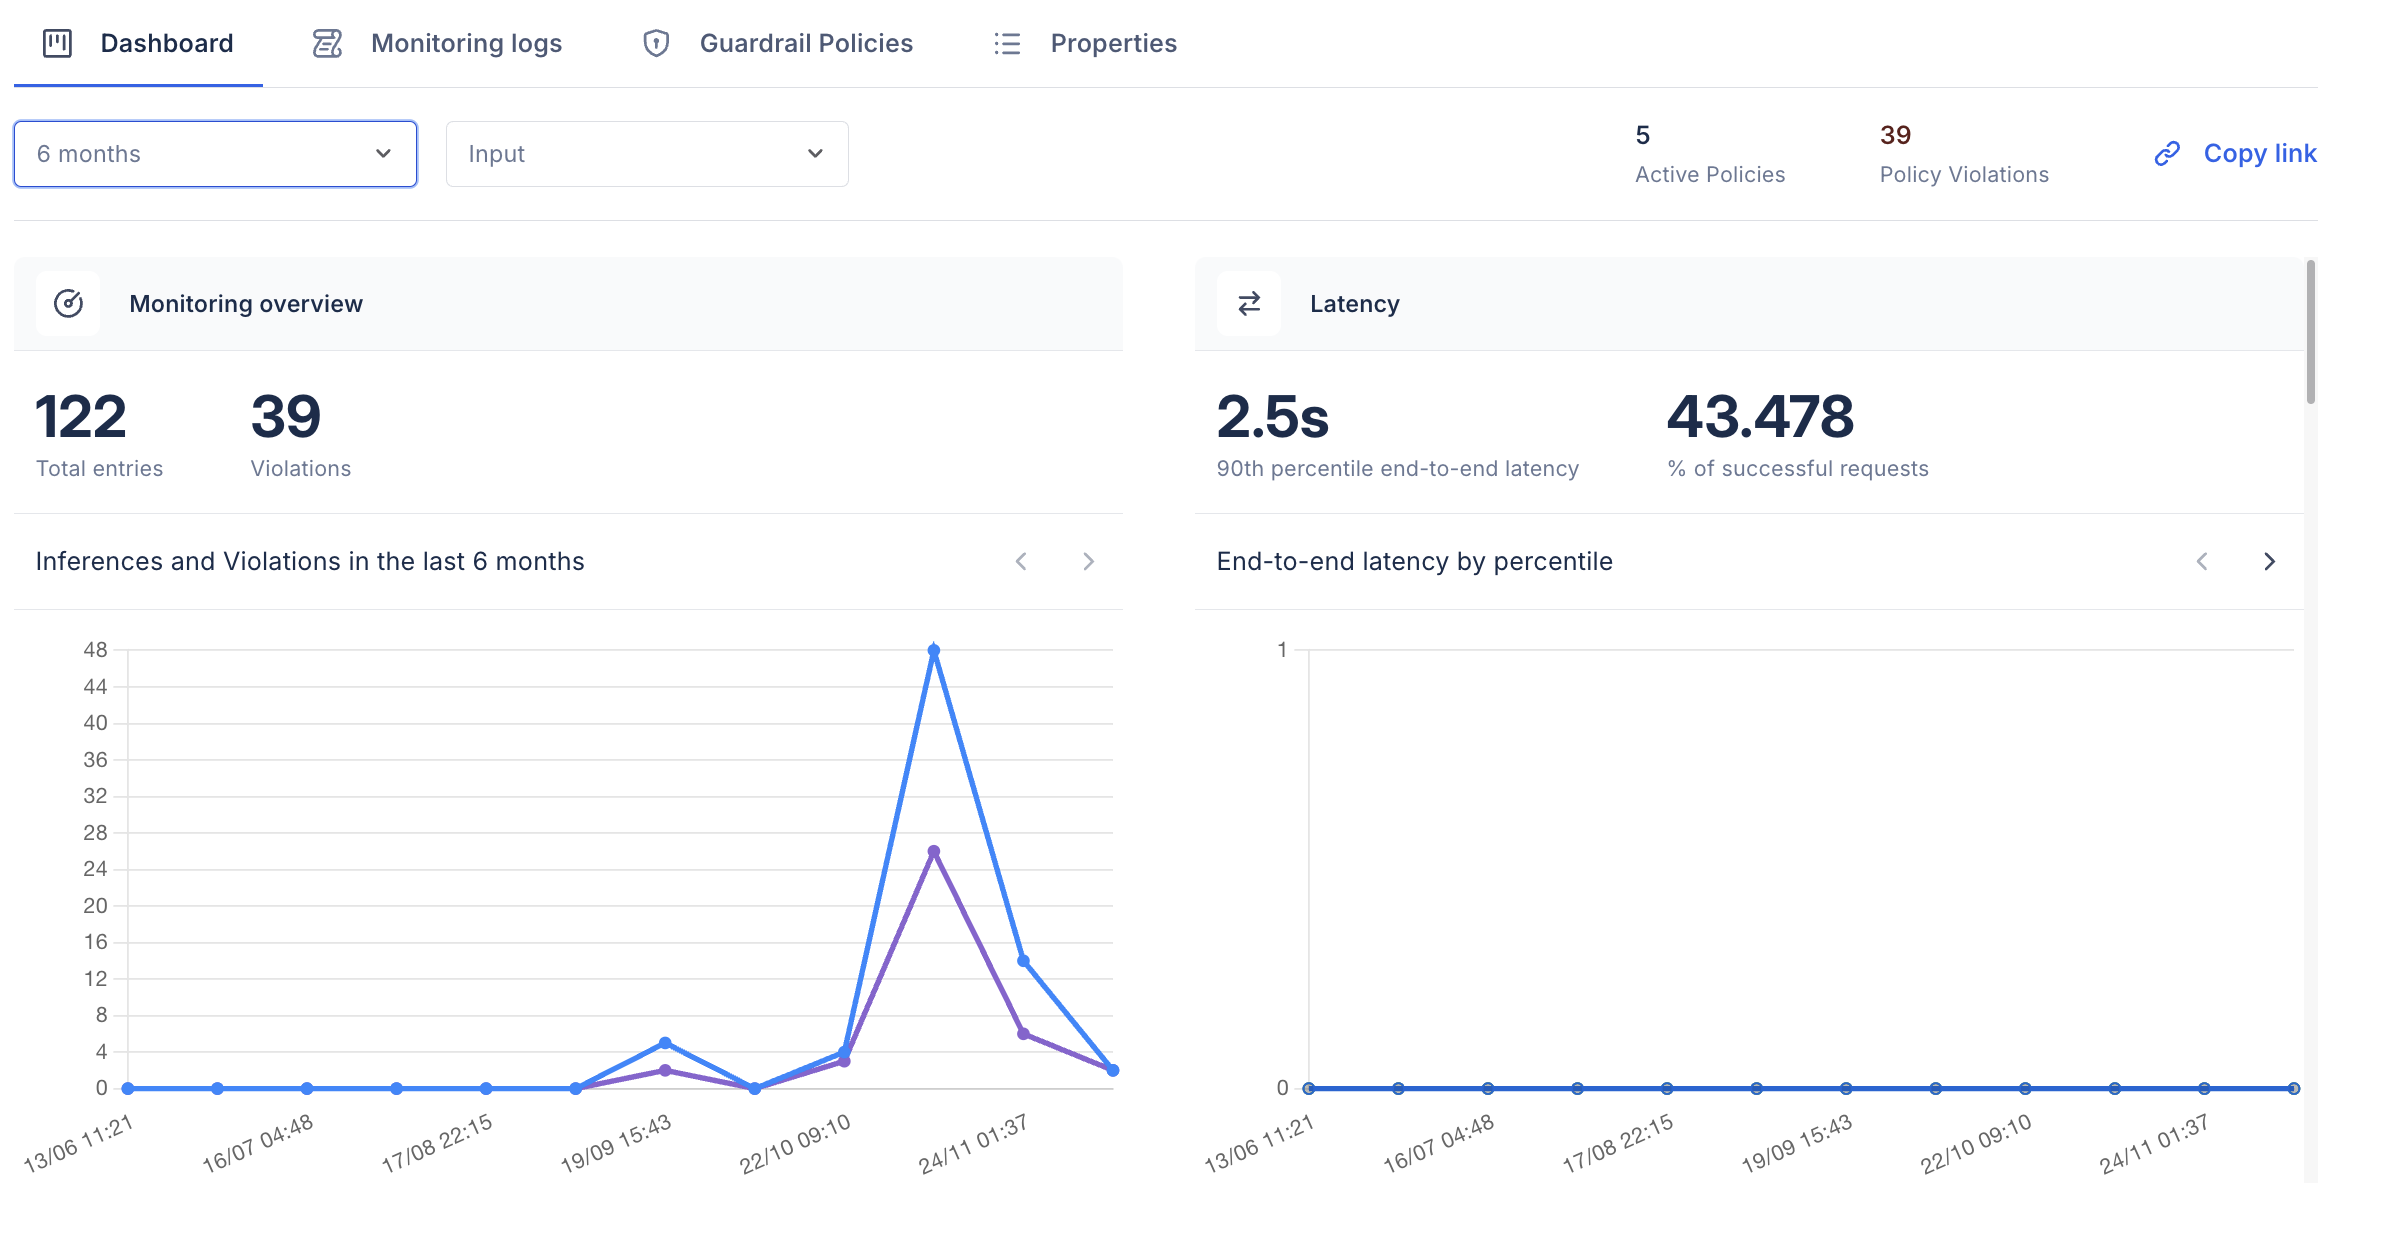
DynamoGuard currently provides the following top-level metrics, along with additional guardrail-specific metrics.
- Active Policies: The number of unique policies run in the specified time period, for the particular model
- Policy Violations: The number of unique user inputs (or model responses) violating a policy in the specified time period.
- Monitoring Overview: Insights into the number of unique model inferences and total violations across all active guardrails.
- Latency: Insights into the latency for guardrails. This includes: Input and Output guardrail latency, end-to-end latency, and LLM completion latency.
- Request Failure and Success: Insights into guardrail and model request success and failure rates.